Innovative AI Solutions

Tailor-made AI solutions to maximize efficiency and minimize costs for businesses worldwide.

AI-Powered SaaS
A 3D icon with the letter 'S' in white, encased in a blue cloud-like shape on a white square. It appears to be floating with a shadow cast below it, set against a solid blue background.

Streamline operations with our advanced AI-powered SaaS platforms designed for business growth.

A computer screen displaying analytics dashboards with various charts, including a line graph on the left and a cohort analysis table on the right. The table is populated with different shades of blue, indicating varying levels of user activity over several weeks. Text labels and numbers detail user retention statistics.
A web page from Razorpay displaying marketing content about financial services. The page includes a 3D illustration of a cube surrounded by floating labels with financial terms like 'Virtual Account' and 'Vendor Payouts'. The text encourages business growth through automated financial solutions. Navigation links for various services are visible at the top.
Data Analytics

Transform data into actionable insights to drive informed decision-making and enhance performance.

Automation Tools

Enhance efficiency with our automation tools designed to simplify and optimize business processes.

AI Solutions

Transforming businesses with tailored AI tools and innovative solutions.

A laptop with an open screen displaying dashboard analytics featuring charts, graphs, and numerical data related to sales and subscriptions. The interface is predominantly dark-themed with sections highlighting key performance metrics. The device shown is a MacBook Pro, indicated by the keyboard layout and branding.
Data Analytics

Our data analytics services empower businesses to make informed decisions and optimize operations through actionable insights derived from advanced AI technologies and comprehensive data analysis.

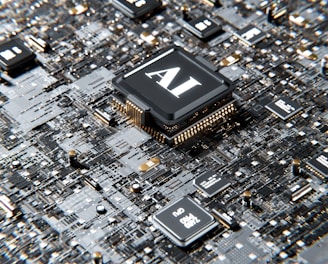
A close-up view of a computer motherboard with a prominent microchip labeled 'AI' at the center. The board is densely populated with circuits, capacitors, and other electronic components in various shades of gray, black, and gold.
Automation Tools

We provide automation tools designed to streamline processes, enhance productivity, and drive growth, enabling businesses to operate more efficiently and focus on core objectives.

Customer Feedback

Discover how our solutions have transformed businesses worldwide through innovation.

Gybor's AI tools significantly improved our efficiency and reduced operational costs. Highly recommend their services for any business looking to innovate.

Alex Johnson
A computer screen displaying a data analytics dashboard with graphs and charts. A blue line graph shows fluctuations in data over time, and a section highlights the number of page views. A pie chart is partially visible, indicating a breakdown of different data elements.

Dubai, UAE

The AI solutions provided by Gybor have revolutionized our operations, making processes smoother and more efficient. Their support has been invaluable in our growth journey.

A laptop on a wooden desk displays a web application interface featuring graphs and statistics. Beside it, a large monitor shows a webpage promoting an all-in-one meeting app. A cup with a recognizable green and white logo sits on the desk.
Maria Lopez

Dubai, UAE

★★★★★
★★★★★